For a PDF version of the below commentary please click here Weekly Letter 10-27-2014
Commentary at a glance:
-Staying in roller coaster mode, last week saw some of the best performance of the past year.
-Stress test results are in and do not look all bad.
-Earnings season continues to move forward with the results being less than stellar.
-Brazil has re-elected Dilma Rousseff as President; the stock market fell.
-Economic news releases in aggregate came in at market expectations.
Market Wrap-Up: What a difference one week can make from the stand point of a technical analysis. Gone is the negative assessment of all three of the major indexes and the VIX, which seems to have nearly forgotten why it spiked to the highest level we have seen in the past two years. Below are my standard charts with the various indexes drawn in green lines, while their most recent trading channels have been drawn in red. The VIX is the odd man out as its chart shows the VIX in green and the one-year average level of the VIX in red:
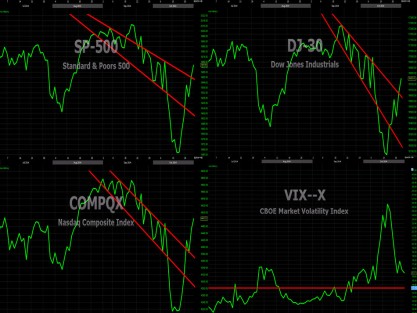
As you can clearly see above, all three of the major indexes turned in a heroic move last week, in one case even breaking out of the recent trend channel analysis. The NASDAQ (lower left pane above) is clearly the strongest of the three major indexes at this point. This is for a few different reasons. First, the NASDAQ broke into its most recent trading channel early last week. The index then proceeded to break right through the trading channel to the upside, only to fall back down to the upper bound of the channel and bounce off of it to the upside. Along the way the index also managed to easily move through various other resistance levels, such as the low point seen back in August and the low point reached prior to the decline in early October. At this point the next major level of resistance will be the high level hit multiple times during September. The S&P 500 (upper left pane above) and the Dow (upper right pane above) are both in roughly similar boats, as they technically broke into and through their most recent trading channels, but with a slight hiccup in the middle of the move. Both of these indexes need to come back down to test the upper bound of the trading channel and bounce higher for them to get to the same technical conviction level as the NASDAQ. One area of caution surrounding the move is the volume with which the move was made. Volume went from being very high two weeks ago, to just average, and this could mean that while the move was nice last week it may not last; more on this topic below in the Market Statistics section. While the indexes were moving sharply higher the VIX was headed in the opposite direction, falling by more than 24 percent during the course of the week, nearly fully erasing the spike that had occurred over the previous few weeks.
National News: National news last week seemed to be all about the rally in the global financial markets. While there were very few concrete reasons for such a rally to have taken place, the pundits in the media were glad to talk about something other than declining markets. One of the most talked about drivers for the market performance last week was earnings season and the fact that 75 percent of the companies that have reported earnings have beaten estimates. While this may sound good at first glance, you may remember that expectations for the third quarter earnings season are very low. They had seemingly been revised down every week since the end of the second quarter. So while more companies are beating earnings than was expected, they are doing so mainly because of the extremely low bar set for expectations.
Below is a table of the better-known companies that released earnings last week and the amount by which they either exceeded or fell short of expectations. As you can see it was a pretty mixed bag of results last week. Negative earnings surprises are highlighted in red while positive surprises in excess of 10 percent are highlighted in green:
| 3M |
1% |
Ford Motor |
26% |
PulteGroup |
3% |
| Amazon.com |
-30% |
General Dynamics |
7% |
Raytheon |
2% |
| American Airlines Group |
2% |
General Motors |
2% |
Reynolds American |
4% |
| Apple |
9% |
Genuine Parts |
1% |
Simon Property |
-6% |
| AT&T |
-2% |
Halliburton |
8% |
Six Flags Entertainment |
-28% |
| Boeing |
9% |
Harley-Davidson |
15% |
Texas Instruments |
7% |
| Bristol-Myers Squibb |
10% |
IBM |
-14% |
Tractor Supply |
8% |
| Cabela’s |
-6% |
Janus Capital Group |
0% |
Travelers Companies |
19% |
| Caterpillar |
29% |
Kimberly-Clark |
5% |
U.S. Bancorp |
0% |
| Chipotle Mexican Grill |
8% |
Lexmark International |
13% |
Under Armour |
3% |
| Chubb |
11% |
Lockheed Martin |
1% |
Union Pacific |
1% |
| Coca-Cola |
2% |
McDonald’s |
11% |
United Technologies |
1% |
| Colgate-Palmolive |
1% |
Microsoft |
10% |
Verizon Communications |
-3% |
| Cree |
-46% |
Northrop Grumman |
7% |
VF |
-1% |
| Dow Chemical |
7% |
Occidental Petroleum |
-5% |
Waste Connections |
4% |
| Dr Pepper Snapple |
11% |
O’Reilly Automotive |
6% |
Werner Enterprises |
0% |
| Dunkin’ Brands |
4% |
Overstock.com |
17% |
Wyndham Worldwide |
2% |
| Eli Lilly and |
0% |
Owens Corning |
26% |
Xerox |
4% |
| Ethan Allen Interiors |
26% |
Procter & Gamble |
-1% |
Yahoo! |
105% |
As you can see above, there continues to be more green than red, which is a good sign for the quarter. However, one of the red earnings numbers was particularly concerning, that being Amazon. Amazon has long been a darling company that is either loved or hated by investors, but few can argue that Amazon is not innovative. When Amazon missed estimates by 30 percent this quarter, however, some investors started to cry foul as CEO Jeff Bezos seems willing to spend all of the money Amazon makes on obscure technologies and ideas that seem to not pan out. One of the latest items was the major loss the company took on the Amazon Fire Smart phone, which failed to sell. The company still has millions of the phones and cannot currently get rid of them. In stark contrast to Amazon is Overstock.com, which turned in a very nice quarter, beating expectations by 17 percent as the company focused on what makes it good, which is selling items online, not working up some massive new technology. According to Factset Research we have now seen 208 of the S&P 500 companies release their results. Of the 208 that have released 75 percent have met or beaten earnings estimates while 25 percent have fallen short of expectations. This 75 percent figure is above both the one-year and five-year average of companies beating expectations. When looking at revenue the picture is a worse as only 60 percent of companies have reported better than expected sales, while 40 percent have missed estimates. What this tells us is that companies are beating estimates not because of sales, but because of other actions such as lowering costs or through other management wizardry and the magic of corporate accounting. We are still a long way from the end of the third quarter earnings season, but so far the overall outlook is mixed.
This week is the single busiest week for earnings releases for the third quarter of 2014 as there are more than 1,500 companies releasing their results. Below is a table of the better known companies releasing earnings with the potentially most impactful releases highlighted in green:
| Aetna |
Coach |
Iron Mountain |
Sherwin-Williams |
| Aflac |
ConocoPhillips |
Kellogg |
Sirius XM Radio |
| Allstate |
Crocs |
Kraft Foods Group |
Southern |
| Altria Group |
Cummins |
LinkedIn |
Spirit Airlines |
| AmerisourceBergen |
Denny’s |
Manitowoc |
Starbucks |
| Amgen |
Electronic Arts |
Marriott International |
Starwood Hotels |
| Arrow Electronics |
Equity Residential |
MasterCard |
Sturm Ruger |
| Arthur J. Gallagher |
Exxon Mobil |
Merck & Co |
SunPower |
| Atmel |
Facebook |
Metlife |
Time Warner Cable |
| AutoNation |
Freeport-McMoRan |
MGM Resorts |
T-Mobile |
| Avis Budget Group |
Gilead Sciences |
New York Times |
Twitter |
| Ball |
GNC |
Noble Corporation |
Visa |
| Big 5 Sporting Goods |
Goodyear Tire & Rubber |
Noble Energy |
Waste Management |
| BorgWarner |
GoPro |
Owens & Minor |
WellPoint |
| Buffalo Wild Wings |
Groupon |
Panera Bread |
Western Union |
| Cardinal Health |
Hanesbrands |
Parker Hannifin |
Weyerhaeuser |
| CBRE Group |
HealthSouth |
Pfizer |
Whirlpool |
| Chevron |
Hershey |
Phillips 66 |
Wisconsin Energy |
| Cliffs Natural Resources |
Hess |
Public Storage |
Wynn Resorts |
| Clorox |
Hyatt Hotels |
Ralph Lauren |
Xcel Energy |
Energy will be the focal point of earnings this week as nearly all of the major integrated oil and gas companies from around the world release their earnings for the third quarter. Of particular interest during these releases will be the impact, if any, of the operations of companies operating in west Africa, as we have already heard from companies like Exxon that have warned financials could be impacted by the Ebola outbreak. Two other companies that will be closely watched are MasterCard and Visa as both of these companies combined process and majority of credit card payments made in the US and typically have a good feel for consumer spending. Add in the smattering of consumer product companies such as Starbucks, Ralph Lauren, T-Mobile and Coach and it should make for an interesting week of results.
International News: International news last week focused mainly on a few old stories that are starting to make headlines yet again. The main focus of financial news last week was the release of the European Central Bank (ECB) banking stress tests, which were released on Sunday. In total there were 24 banks that “failed” the stress test, but of the 24, ten fixed the problem between being notified by the ECB and the release of the report, so there are only about 14 banks that still need some work. Of those 14 it is not surprising to see that four of them are in Italy, two are in Greece and the balance are in very small European countries such as Cyprus and Slovenia. With the stress test completed, what does it mean for the remaining troubled banks? Very little. The banks have only to come up with and implement a plan to strengthen their balance sheets enough to pass the test. Most likely it means the individual countries in which the banks are located will bail them out by backing the companies. In some instances it means the banks may have to borrow funds from the ECB directly. Overall, the test shows that the banks in Europe have largely cleaned up their assets and business models since the decline in 2008, which is good since it does not look like Europe is currently on steady financial footing. Stress in the Euro zone has recently lead the ECB to start buying bonds in a form of quantitative easing very similar to the QE the US Federal reserve launched under Ben Bernanke several years ago, which is currently being tapered. It will take a while to see if the ECB can do enough to stabilize the European economy or if the European economies will continue to fall further and further back into a recession. One wild card that remains with the situation in Europe is the natural gas normally supplied by Russia. Russia is still fighting over part of Ukraine and backing the rebels, so as winter draws near we may see increasing tension between the two sides. Ukraine knows it is in trouble this winter if the dispute is not settled. In other international news last week, Dilma Rousseff won re-election as President in Brazil in a runoff election that was finalized over the weekend. This result means there will likely be little change in the form of a more friendly business environment in Brazil and is largely why the main financial market in Brazil, the SE BOVESPA, declined by more than 6 percent over the course of the past week.
Market Statistics: Last week saw all three of the major US indexes move substantially higher on average volume as they turned in one of their best weeks in the past year:
| Index |
Change |
Volume |
| NASDAQ |
5.29% |
Average |
| S&P 500 |
4.12% |
Average |
| Dow |
2.59% |
Average |
While all three of the major indexes saw strong performance during the week, the performance was a little awkward as it was done on average volume. After seeing some of the highest volumes of the year two weeks ago when the markets were moving lower, seeing such weak relative volume on the upside last week gives some pause for concern. Clearly not all of the investors who were hurt two weeks ago in the decline jumped back into the markets last week for the bounce, so there must be a bit of money waiting on the sidelines. Will the money be engaged or will it be perfectly content to remain on the sidelines and watch as the market tries to make sense of all of the contradicting information that is suddenly making headlines around the world.
When looking at sectors, the following were the top 5 and bottom 5 performers over the course of the previous week:
| Top 5 Sectors |
Change |
Bottom 5 Sectors |
Change |
| Biotechnology |
8.82% |
Materials |
1.60% |
| Healthcare |
6.79% |
Consumer Staples |
1.78% |
| Semiconductors |
6.73% |
US Telecommunications |
1.99% |
| Medical Devices |
6.03% |
Global Telecommunications |
2.33% |
| Pharmaceuticals |
5.83% |
Residential Real Estate |
2.46% |
Last week the sectors that performed the best were almost an exact copy of the sectors of the markets that saw the worst performance two weeks ago. This is not uncommon when the markets are chopping wildly as investors buy and sell risk in their accounts. Last week it was Biotechnologies’ turn to shine as it moved back into the best performing sector of the markets for 2014, so far just barely edging out the strong performance we have seen in real estate. On the flip side it was not surprising to see that materials, consumer staples and telecommunications saw the weakest performance of the week last week as these are some of the main sectors investors view as safe havens. When the markets turn into rally mode, many investors pull from less risky assets and put the money into more risky assets as they “chase” the markets. This is largely what was driving the performance of the various sectors of the markets over the past week.
With such strong gains in the broad equity markets last week it was not surprising to see that fixed income by and large had a difficult week as investors moved from the safety of bonds into the high flying equity markets:
| Fixed Income |
Change |
| Long (20+ years) |
-1.12% |
| Middle (7-10 years) |
-0.49% |
| Short (less than 1 year) |
0.02% |
| TIPS |
-0.62% |
There was no flash crash with yields declining to under 2 percent as they did two weeks ago, and there was no apparent reason for investors to stay in long US government bonds, which they sold in large numbers, pushing the prices down as they shifted their allocation toward stocks. The long end of the yield curve (20 + years) was hit the hardest last week while the short term bonds (less than one year) saw a very slight rally. TIPS continued to struggle as there is just no sign of inflation in any meaningful amount coming out of any of the government’s economic data points. Last week the value of the US dollar advanced by 0.53 percent against a basket of international currencies. The strongest of the currencies last week was the Australian dollar as it gained 0.50 percent against the US dollar. The Euro will be in the spotlight this week as the results of the ECB banking stress tests are digested by the markets and the economies of the Euro continue to struggle with large amounts of weakness.
Commodities were mixed last week as investors moved gold lower after a strong week two weeks ago, while the soft commodities moved higher and oil continued its path downward:
| Metals |
Change |
Commodities |
Change |
| Gold |
-0.54% |
Oil |
-2.10% |
| Silver |
-0.48% |
Livestock |
1.13% |
| Copper |
1.13% |
Grains |
1.64% |
| Agriculture |
-1.64% |
The overall Goldman Sachs Commodity Index turned in a loss of 0.50 percent last week, while the Dow Jones UBS Commodity Index declined by 0.35 percent. Oil continued to slide, last week falling by 2.10 percent as supply continued to outpace demand by a wide margin and Saudi Arabia continues to make no major changes in its output of oil. Oil has now fallen 24 percent since the middle of June in what is turning into one of the longest and steepest declines we have seen in the price of oil since it fell off a cliff back in 2008. But the continuously falling oil prices still means prices at the pump are likely to move even lower with many areas of the country likely to see prices move below $3 per gallon. According to the AAA fuel gauge report, the nationwide average for a gallon of gasoline is currently $3.04, which is down six cents from last week and looks headed to move below $3. If you happen to live in the Southern part of the US you have already probably seen prices move below $3 as prices typically fall fastest near the large refineries before slowly spreading across the rest of the US.
Last week was a predominantly higher week for the global indexes with the majority of the major indexes advancing while there were only a handful of countries that turned in negative performance. The best performance globally last week was found in Japan with the Tokyo based Nikkei Index advancing by 5.22 percent. Brazil saw the worst performance of the week as the Sao Paulo based Se BOVESPA fell by 6.79 percent, thanks in large part to the Presidential election runoff that took place over the weekend and saw Dilma Rousseff retain control of the government.
With the major indexes all moving higher by such a large amount, it was not surprising to see that the VIX fell by more than 26 percent over the course of the previous week. During the decline last week we had something occur on the VIX that is very rare; the VIX fell by more than 10 percent three days in a row. Looking back in history to early 2006, we have not had another three-day period with declines in excess of 10 percent per day. We have only seen the VIX decline by more than 10 percent two days in a row 5 other times looking back over the same time period. With this in mind, the chart below visually shows just how fast the VIX (green line) has come back down, but it also shows that the VIX is in an uptrend, as signified by the light blue line:
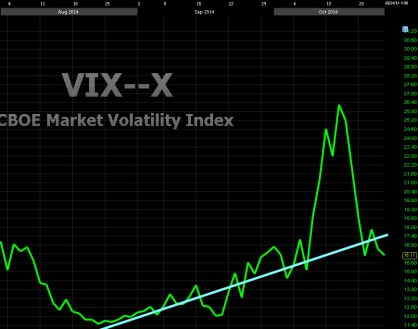
The spike of the past three weeks is officially over at this point, but it is not without an impact. While the VIX may trend lower from here, it is still very high when compared to where it has come from, but it is currently at a healthy level, a level in which investors remember that risks are in the equity markets at all times. Hopefully, this reminder keeps them from becoming complacent about the risks of investing. At the current level of 16.11 the VIX is implying a move of about 4.65 percent over the course of the next 30 days and, as always, the direction of the move is unknown.
For the trading week ending on 10/24/2014, returns in FSI’s hypothetical models* (net of a 1% annual management fee) were as follows:
|
Last Week |
Year to Date |
| Aggressive Model |
3.20 % |
1.79 % |
| Aggressive Benchmark |
2.77 % |
0.19 % |
| Growth Model |
2.92 % |
3.13 % |
| Growth Benchmark |
2.16 % |
0.25 % |
| Moderate Model |
2.50 % |
4.13 % |
| Moderate Benchmark |
1.54 % |
0.26 % |
| Income Model |
2.31 % |
4.31 % |
| Income Benchmark |
0.77 % |
0.26 % |
*Model performance does not represent any specific account performance but rather a model of holdings based on risk levels that are like our actual holdings, the hypothetical models are rebalanced daily to model targets.
We made no changes in any of our models over the course of the previous week. The investments we own by and large performed very well last week, despite such a large increase in the markets. The current allocation of holdings we own in the various models have been providing protection during the recent downward movements of the markets while, as shown last week, participating in a very good amount of the upside movements of the overall markets.
Economic News: Last week was as neutral a week for economic news releases as we can get as all of the releases came in very close to market expectations with no surprise either positive or negative:
| Economic Impact |
Date |
Economic News Release |
Date Range |
Actual |
Expectation |
| Neutral |
10/21/2014 |
Existing Home Sales |
September 2014 |
5.17M |
5.11M |
| Neutral |
10/22/2014 |
CPI |
September 2014 |
0.10% |
0.00% |
| Neutral |
10/22/2014 |
Core CPI |
September 2014 |
0.10% |
0.20% |
| Neutral |
10/23/2014 |
Initial Claims |
Previous Week |
283K |
283K |
| Neutral |
10/23/2014 |
Continuing Claims |
Previous Week |
2351K |
2390K |
| Neutral |
10/23/2014 |
Leading Indicators |
September 2014 |
0.80% |
0.60% |
| Neutral |
10/24/2014 |
New Home Sales |
September 2014 |
467K |
473K |
Data for table from Econoday.com, Bloomberg and Yahoo Finance
Last week started on Tuesday with the release of the existing home sales figure for the month of September, which came in as expected and was largely overlooked by the markets. On Wednesday the Consumer Price Index (CPI) figure for the month of September was released and came in showing a one tenth of a percent increase, while the core CPI (CPI minus the volatile things like food and energy) figure showed the same small increase of one tenth of a percent. Both of these figures indicated that inflation is currently not an issue in the US economy. However, prices are rising at a pace that is slow enough to cause some concern at the Federal Reserve, as they would much rather have inflation than deflation, something some Europeans are likely to experience in the coming quarters. On Thursday the standard weekly unemployment related figures were released with both coming in very close to expectations and the markets not giving the releases a second thought. Later during the day on Thursday the Leading Indicators (LEI) figure for the month of September was released and came in very close to the estimated 0.6 percent with the reading being 0.8 percent. While this number is positive it was not surprising to the markets as the PEI is just a compilation of various other economic indicators pulled into just one figure. On Friday the New Home Sales figure for the month of September was released, with the figure coming in much like all of the other releases of the week, close to market expectations.
This week is a busy week for economic news releases as we have a bunch of month-end data being released at the end of the week, as well as some key economic growth figures earlier during the week. The releases that have the highest potential to move the markets are highlighted in green:
| Date |
Release |
Release Range |
Market Expectation |
| 10/27/2014 |
Pending Home Sales |
September 2014 |
0.50% |
| 10/28/2014 |
Durable Orders |
September 2014 |
0.60% |
| 10/28/2014 |
Durable Goods -ex transportation |
September 2014 |
0.50% |
| 10/28/2014 |
Case-Shiller 20-city Index |
August 2014 |
5.50% |
| 10/28/2014 |
Consumer Confidence |
October 2014 |
87.2 |
| 10/29/2014 |
FOMC Rate Decision |
October 2014 |
0.25% |
| 10/30/2014 |
Initial Claims |
Previous Week |
284K |
| 10/30/2014 |
Continuing Claims |
Previous Week |
2375K |
| 10/30/2014 |
GDP-Adv. |
Q3 2014 |
3.00% |
| 10/31/2014 |
Personal Income |
September 2014 |
0.30% |
| 10/31/2014 |
Personal Spending |
September 2014 |
0.10% |
| 10/31/2014 |
PCE Prices – Core |
September 2014 |
0.10% |
| 10/31/2014 |
Chicago PMI |
October 2014 |
60 |
| 10/31/2014 |
University of Michigan Consumer Sentiment Index |
October 2014 |
86.4 |
Data for table from Econoday.com, Bloomberg and Yahoo Finance
This week starts off on Monday with the release of the pending home sales figure for the month of September, which is expected to show a half of a percent increase over the August levels. Since this release is pending sales it would take something drastic one way or the other to overshadow the housing figures for actual sales during September released last week. On Tuesday durable goods orders for the month of September will be released and expectations are pretty low with a gain of less than one percent on both overall orders and orders excluding transportation. We could see an upside surprise on this one. Later during the day on Tuesday the Case-Shiller 20 City Home Price Index for the month of August is set to be released, but as normal the data is so stale the market will likely not notice the release. Being released at the same time, consumer confidence, as measured by the government, will likely be noticed by the markets. Confidence is expected to have increased slightly with most of the increase being explained by the declining price in gasoline and energy. On Wednesday the latest interest rate decision will be released by the Fed and the release will be closely watched. October is the month during which the tapering program is expected to come to an end and the Fed will stop buying bonds with new money on the open market. However, there is some speculation that given the weakness we have seen recently in the economic data, the Fed may hold off on ending the tapering program. The market will also be closely watching for any new language about when the Fed may increase interest rates. If the Fed stays with the game plan it has been using for the last year, there will be a few changes to the language, but the changes will be vague and undecipherable. On Thursday the focus of the day will be on the advanced reading for third quarter GDP, as estimated by the US government. Expectations are for a GDP reading of 3 percent growth during the quarter, which is well below the second quarter figure of 4.6 percent. This release could really have an impact on the overall market if it either beats or misses expectations by a meaningful margin, as the figure is used in all sorts of calculations about many financial instruments. Friday starts with the release of personal income and spending as well as PCE prices, all for the month of September. All three figures are expected to show very little change between August and September and would have to deviate widely from expectations to get a market reaction. Later during the day on Friday the Chicago area PMI for the month of October is set to be released and the market will be closely watching to see if the region can stay on the manufacturing expansion path it has been on for the past few months. Wrapping up the week on Friday is the release of the University of Michigan’s Consumer Sentiment index for the month of October, which is expected to show no change over the level seen at the mid-way point through October released two weeks ago. The only Fed official speaking this week is the Chairwoman herself, Janet Yellen, on Thursday, so the market will surely be tuned into that as well.
Fun fact of the week:
The Greek currency, the Drachma, was started around 670 BC and came to an end in 2002 when Greece adopted the Euro as their national currency.
Source:fleur-de-coin.com

Peter’s Financial Market Commentary October 27th 2014
October 27, 2014
For a PDF version of the below commentary please click here Weekly Letter 10-27-2014
Commentary at a glance:
-Staying in roller coaster mode, last week saw some of the best performance of the past year.
-Stress test results are in and do not look all bad.
-Earnings season continues to move forward with the results being less than stellar.
-Brazil has re-elected Dilma Rousseff as President; the stock market fell.
-Economic news releases in aggregate came in at market expectations.
Market Wrap-Up: What a difference one week can make from the stand point of a technical analysis. Gone is the negative assessment of all three of the major indexes and the VIX, which seems to have nearly forgotten why it spiked to the highest level we have seen in the past two years. Below are my standard charts with the various indexes drawn in green lines, while their most recent trading channels have been drawn in red. The VIX is the odd man out as its chart shows the VIX in green and the one-year average level of the VIX in red:
As you can clearly see above, all three of the major indexes turned in a heroic move last week, in one case even breaking out of the recent trend channel analysis. The NASDAQ (lower left pane above) is clearly the strongest of the three major indexes at this point. This is for a few different reasons. First, the NASDAQ broke into its most recent trading channel early last week. The index then proceeded to break right through the trading channel to the upside, only to fall back down to the upper bound of the channel and bounce off of it to the upside. Along the way the index also managed to easily move through various other resistance levels, such as the low point seen back in August and the low point reached prior to the decline in early October. At this point the next major level of resistance will be the high level hit multiple times during September. The S&P 500 (upper left pane above) and the Dow (upper right pane above) are both in roughly similar boats, as they technically broke into and through their most recent trading channels, but with a slight hiccup in the middle of the move. Both of these indexes need to come back down to test the upper bound of the trading channel and bounce higher for them to get to the same technical conviction level as the NASDAQ. One area of caution surrounding the move is the volume with which the move was made. Volume went from being very high two weeks ago, to just average, and this could mean that while the move was nice last week it may not last; more on this topic below in the Market Statistics section. While the indexes were moving sharply higher the VIX was headed in the opposite direction, falling by more than 24 percent during the course of the week, nearly fully erasing the spike that had occurred over the previous few weeks.
National News: National news last week seemed to be all about the rally in the global financial markets. While there were very few concrete reasons for such a rally to have taken place, the pundits in the media were glad to talk about something other than declining markets. One of the most talked about drivers for the market performance last week was earnings season and the fact that 75 percent of the companies that have reported earnings have beaten estimates. While this may sound good at first glance, you may remember that expectations for the third quarter earnings season are very low. They had seemingly been revised down every week since the end of the second quarter. So while more companies are beating earnings than was expected, they are doing so mainly because of the extremely low bar set for expectations.
Below is a table of the better-known companies that released earnings last week and the amount by which they either exceeded or fell short of expectations. As you can see it was a pretty mixed bag of results last week. Negative earnings surprises are highlighted in red while positive surprises in excess of 10 percent are highlighted in green:
As you can see above, there continues to be more green than red, which is a good sign for the quarter. However, one of the red earnings numbers was particularly concerning, that being Amazon. Amazon has long been a darling company that is either loved or hated by investors, but few can argue that Amazon is not innovative. When Amazon missed estimates by 30 percent this quarter, however, some investors started to cry foul as CEO Jeff Bezos seems willing to spend all of the money Amazon makes on obscure technologies and ideas that seem to not pan out. One of the latest items was the major loss the company took on the Amazon Fire Smart phone, which failed to sell. The company still has millions of the phones and cannot currently get rid of them. In stark contrast to Amazon is Overstock.com, which turned in a very nice quarter, beating expectations by 17 percent as the company focused on what makes it good, which is selling items online, not working up some massive new technology. According to Factset Research we have now seen 208 of the S&P 500 companies release their results. Of the 208 that have released 75 percent have met or beaten earnings estimates while 25 percent have fallen short of expectations. This 75 percent figure is above both the one-year and five-year average of companies beating expectations. When looking at revenue the picture is a worse as only 60 percent of companies have reported better than expected sales, while 40 percent have missed estimates. What this tells us is that companies are beating estimates not because of sales, but because of other actions such as lowering costs or through other management wizardry and the magic of corporate accounting. We are still a long way from the end of the third quarter earnings season, but so far the overall outlook is mixed.
This week is the single busiest week for earnings releases for the third quarter of 2014 as there are more than 1,500 companies releasing their results. Below is a table of the better known companies releasing earnings with the potentially most impactful releases highlighted in green:
Energy will be the focal point of earnings this week as nearly all of the major integrated oil and gas companies from around the world release their earnings for the third quarter. Of particular interest during these releases will be the impact, if any, of the operations of companies operating in west Africa, as we have already heard from companies like Exxon that have warned financials could be impacted by the Ebola outbreak. Two other companies that will be closely watched are MasterCard and Visa as both of these companies combined process and majority of credit card payments made in the US and typically have a good feel for consumer spending. Add in the smattering of consumer product companies such as Starbucks, Ralph Lauren, T-Mobile and Coach and it should make for an interesting week of results.
International News: International news last week focused mainly on a few old stories that are starting to make headlines yet again. The main focus of financial news last week was the release of the European Central Bank (ECB) banking stress tests, which were released on Sunday. In total there were 24 banks that “failed” the stress test, but of the 24, ten fixed the problem between being notified by the ECB and the release of the report, so there are only about 14 banks that still need some work. Of those 14 it is not surprising to see that four of them are in Italy, two are in Greece and the balance are in very small European countries such as Cyprus and Slovenia. With the stress test completed, what does it mean for the remaining troubled banks? Very little. The banks have only to come up with and implement a plan to strengthen their balance sheets enough to pass the test. Most likely it means the individual countries in which the banks are located will bail them out by backing the companies. In some instances it means the banks may have to borrow funds from the ECB directly. Overall, the test shows that the banks in Europe have largely cleaned up their assets and business models since the decline in 2008, which is good since it does not look like Europe is currently on steady financial footing. Stress in the Euro zone has recently lead the ECB to start buying bonds in a form of quantitative easing very similar to the QE the US Federal reserve launched under Ben Bernanke several years ago, which is currently being tapered. It will take a while to see if the ECB can do enough to stabilize the European economy or if the European economies will continue to fall further and further back into a recession. One wild card that remains with the situation in Europe is the natural gas normally supplied by Russia. Russia is still fighting over part of Ukraine and backing the rebels, so as winter draws near we may see increasing tension between the two sides. Ukraine knows it is in trouble this winter if the dispute is not settled. In other international news last week, Dilma Rousseff won re-election as President in Brazil in a runoff election that was finalized over the weekend. This result means there will likely be little change in the form of a more friendly business environment in Brazil and is largely why the main financial market in Brazil, the SE BOVESPA, declined by more than 6 percent over the course of the past week.
Market Statistics: Last week saw all three of the major US indexes move substantially higher on average volume as they turned in one of their best weeks in the past year:
While all three of the major indexes saw strong performance during the week, the performance was a little awkward as it was done on average volume. After seeing some of the highest volumes of the year two weeks ago when the markets were moving lower, seeing such weak relative volume on the upside last week gives some pause for concern. Clearly not all of the investors who were hurt two weeks ago in the decline jumped back into the markets last week for the bounce, so there must be a bit of money waiting on the sidelines. Will the money be engaged or will it be perfectly content to remain on the sidelines and watch as the market tries to make sense of all of the contradicting information that is suddenly making headlines around the world.
When looking at sectors, the following were the top 5 and bottom 5 performers over the course of the previous week:
Last week the sectors that performed the best were almost an exact copy of the sectors of the markets that saw the worst performance two weeks ago. This is not uncommon when the markets are chopping wildly as investors buy and sell risk in their accounts. Last week it was Biotechnologies’ turn to shine as it moved back into the best performing sector of the markets for 2014, so far just barely edging out the strong performance we have seen in real estate. On the flip side it was not surprising to see that materials, consumer staples and telecommunications saw the weakest performance of the week last week as these are some of the main sectors investors view as safe havens. When the markets turn into rally mode, many investors pull from less risky assets and put the money into more risky assets as they “chase” the markets. This is largely what was driving the performance of the various sectors of the markets over the past week.
With such strong gains in the broad equity markets last week it was not surprising to see that fixed income by and large had a difficult week as investors moved from the safety of bonds into the high flying equity markets:
There was no flash crash with yields declining to under 2 percent as they did two weeks ago, and there was no apparent reason for investors to stay in long US government bonds, which they sold in large numbers, pushing the prices down as they shifted their allocation toward stocks. The long end of the yield curve (20 + years) was hit the hardest last week while the short term bonds (less than one year) saw a very slight rally. TIPS continued to struggle as there is just no sign of inflation in any meaningful amount coming out of any of the government’s economic data points. Last week the value of the US dollar advanced by 0.53 percent against a basket of international currencies. The strongest of the currencies last week was the Australian dollar as it gained 0.50 percent against the US dollar. The Euro will be in the spotlight this week as the results of the ECB banking stress tests are digested by the markets and the economies of the Euro continue to struggle with large amounts of weakness.
Commodities were mixed last week as investors moved gold lower after a strong week two weeks ago, while the soft commodities moved higher and oil continued its path downward:
The overall Goldman Sachs Commodity Index turned in a loss of 0.50 percent last week, while the Dow Jones UBS Commodity Index declined by 0.35 percent. Oil continued to slide, last week falling by 2.10 percent as supply continued to outpace demand by a wide margin and Saudi Arabia continues to make no major changes in its output of oil. Oil has now fallen 24 percent since the middle of June in what is turning into one of the longest and steepest declines we have seen in the price of oil since it fell off a cliff back in 2008. But the continuously falling oil prices still means prices at the pump are likely to move even lower with many areas of the country likely to see prices move below $3 per gallon. According to the AAA fuel gauge report, the nationwide average for a gallon of gasoline is currently $3.04, which is down six cents from last week and looks headed to move below $3. If you happen to live in the Southern part of the US you have already probably seen prices move below $3 as prices typically fall fastest near the large refineries before slowly spreading across the rest of the US.
Last week was a predominantly higher week for the global indexes with the majority of the major indexes advancing while there were only a handful of countries that turned in negative performance. The best performance globally last week was found in Japan with the Tokyo based Nikkei Index advancing by 5.22 percent. Brazil saw the worst performance of the week as the Sao Paulo based Se BOVESPA fell by 6.79 percent, thanks in large part to the Presidential election runoff that took place over the weekend and saw Dilma Rousseff retain control of the government.
With the major indexes all moving higher by such a large amount, it was not surprising to see that the VIX fell by more than 26 percent over the course of the previous week. During the decline last week we had something occur on the VIX that is very rare; the VIX fell by more than 10 percent three days in a row. Looking back in history to early 2006, we have not had another three-day period with declines in excess of 10 percent per day. We have only seen the VIX decline by more than 10 percent two days in a row 5 other times looking back over the same time period. With this in mind, the chart below visually shows just how fast the VIX (green line) has come back down, but it also shows that the VIX is in an uptrend, as signified by the light blue line:
The spike of the past three weeks is officially over at this point, but it is not without an impact. While the VIX may trend lower from here, it is still very high when compared to where it has come from, but it is currently at a healthy level, a level in which investors remember that risks are in the equity markets at all times. Hopefully, this reminder keeps them from becoming complacent about the risks of investing. At the current level of 16.11 the VIX is implying a move of about 4.65 percent over the course of the next 30 days and, as always, the direction of the move is unknown.
For the trading week ending on 10/24/2014, returns in FSI’s hypothetical models* (net of a 1% annual management fee) were as follows:
*Model performance does not represent any specific account performance but rather a model of holdings based on risk levels that are like our actual holdings, the hypothetical models are rebalanced daily to model targets.
We made no changes in any of our models over the course of the previous week. The investments we own by and large performed very well last week, despite such a large increase in the markets. The current allocation of holdings we own in the various models have been providing protection during the recent downward movements of the markets while, as shown last week, participating in a very good amount of the upside movements of the overall markets.
Economic News: Last week was as neutral a week for economic news releases as we can get as all of the releases came in very close to market expectations with no surprise either positive or negative:
Data for table from Econoday.com, Bloomberg and Yahoo Finance
Last week started on Tuesday with the release of the existing home sales figure for the month of September, which came in as expected and was largely overlooked by the markets. On Wednesday the Consumer Price Index (CPI) figure for the month of September was released and came in showing a one tenth of a percent increase, while the core CPI (CPI minus the volatile things like food and energy) figure showed the same small increase of one tenth of a percent. Both of these figures indicated that inflation is currently not an issue in the US economy. However, prices are rising at a pace that is slow enough to cause some concern at the Federal Reserve, as they would much rather have inflation than deflation, something some Europeans are likely to experience in the coming quarters. On Thursday the standard weekly unemployment related figures were released with both coming in very close to expectations and the markets not giving the releases a second thought. Later during the day on Thursday the Leading Indicators (LEI) figure for the month of September was released and came in very close to the estimated 0.6 percent with the reading being 0.8 percent. While this number is positive it was not surprising to the markets as the PEI is just a compilation of various other economic indicators pulled into just one figure. On Friday the New Home Sales figure for the month of September was released, with the figure coming in much like all of the other releases of the week, close to market expectations.
This week is a busy week for economic news releases as we have a bunch of month-end data being released at the end of the week, as well as some key economic growth figures earlier during the week. The releases that have the highest potential to move the markets are highlighted in green:
Data for table from Econoday.com, Bloomberg and Yahoo Finance
This week starts off on Monday with the release of the pending home sales figure for the month of September, which is expected to show a half of a percent increase over the August levels. Since this release is pending sales it would take something drastic one way or the other to overshadow the housing figures for actual sales during September released last week. On Tuesday durable goods orders for the month of September will be released and expectations are pretty low with a gain of less than one percent on both overall orders and orders excluding transportation. We could see an upside surprise on this one. Later during the day on Tuesday the Case-Shiller 20 City Home Price Index for the month of August is set to be released, but as normal the data is so stale the market will likely not notice the release. Being released at the same time, consumer confidence, as measured by the government, will likely be noticed by the markets. Confidence is expected to have increased slightly with most of the increase being explained by the declining price in gasoline and energy. On Wednesday the latest interest rate decision will be released by the Fed and the release will be closely watched. October is the month during which the tapering program is expected to come to an end and the Fed will stop buying bonds with new money on the open market. However, there is some speculation that given the weakness we have seen recently in the economic data, the Fed may hold off on ending the tapering program. The market will also be closely watching for any new language about when the Fed may increase interest rates. If the Fed stays with the game plan it has been using for the last year, there will be a few changes to the language, but the changes will be vague and undecipherable. On Thursday the focus of the day will be on the advanced reading for third quarter GDP, as estimated by the US government. Expectations are for a GDP reading of 3 percent growth during the quarter, which is well below the second quarter figure of 4.6 percent. This release could really have an impact on the overall market if it either beats or misses expectations by a meaningful margin, as the figure is used in all sorts of calculations about many financial instruments. Friday starts with the release of personal income and spending as well as PCE prices, all for the month of September. All three figures are expected to show very little change between August and September and would have to deviate widely from expectations to get a market reaction. Later during the day on Friday the Chicago area PMI for the month of October is set to be released and the market will be closely watching to see if the region can stay on the manufacturing expansion path it has been on for the past few months. Wrapping up the week on Friday is the release of the University of Michigan’s Consumer Sentiment index for the month of October, which is expected to show no change over the level seen at the mid-way point through October released two weeks ago. The only Fed official speaking this week is the Chairwoman herself, Janet Yellen, on Thursday, so the market will surely be tuned into that as well.
Fun fact of the week:
The Greek currency, the Drachma, was started around 670 BC and came to an end in 2002 when Greece adopted the Euro as their national currency.
Source:fleur-de-coin.com
Share this:
Related
Tagged: Bear Market Correction, Deadcat Bounce, Rousseff wins, technical breakout, Third quarter earnings season