For a PDF version of the below commentary please click here Weekly Letter 3-9-2015
Commentary at a glance:
-US markets turned sharply lower on Friday amid speculation about the first fed rate hike.
-What’s that? Egg on Boehner face again!
-National People’s Congress held its annual meeting in Beijing.
-Earnings season in the US has drawn to a virtual close for the fourth quarter of 2014.
-Economic data showed a strong performance on the surface labor market, which tipped off rate hike fears.
Market Wrap-Up: After having the Dow break down below its support level two weeks ago last week it was the S&P 500’s turn do to so and it did so in a noticeable way. While the equity markets were moving the VIX was also moving, but to a much more muted degree than one might expect given the decline we saw on Friday. The charts below are of the three major US indexes in green with their respective trading channels being drawn by the red lines. The VIX (lower right pane below) is drawn with the index in green and the one year average level of the VIX drawn with the red line:
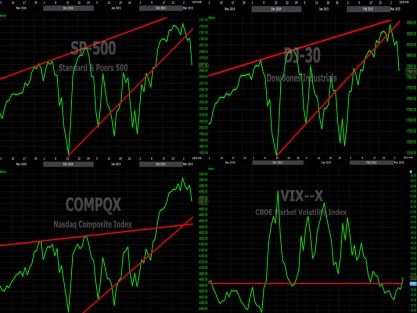
In terms of which of the indexes is currently the strongest, there was no change over the previous week; the NASDAQ is clearly ahead of both the S&P 500 and the Dow. Even with the decline seen last week on NASDAQ, it is still not even close to breaking down into or below its most recent trading channel. In fact, the NASDAQ is closer to making a new all time high than it is to moving back into its trading channel. Both the S&P 500 and the Dow remain well below their respective trading channels and it looks like they are likely not going to make it back to them any time soon. One item that could help the Dow in particular is that AT&T is being dropped as one of the 30 component companies in the Dow and being replaced with Apple. Initially, Apple will have a 4.66 percent weighting in the index, but over the longer term the outlook for Apple is much brighter than it is for AT&T, so it could be a very positive development for the index. After such a decline on the S&P 500 and the Dow, like the one seen on Friday, it would not be unusual for the markets to bounce higher in the following few trading days. This is because the markets tend to overreact both on the positive and on the negative news that moves the markets. Adding to this theory is the fact that the decline last week was done on just average volume and if this was truly the start of a blowout decline, you would normally see volume spiking higher along with the VIX; both of which did not occur last week. In large previous moves to the downside the VIX typically moves noticeably higher and while it did move higher on Friday it did so by less than 10 percent, which means that options traders were not reacting to the market movements, but instead sort of calling its bluff. Looking at trading so far on Monday, it looks like they were correct. Movement of the markets from here is anyone’s guess as speculation on every economic report and speech given by Federal Reserve officials will likely be dissected thousands of times in futile attempts to gain some unknown insight into when the Fed will start to raise interest rates.
National News: John Boehner has once again come out looking like the court jester in Congress as he passed a clean Department of Homeland Security (DHS) funding bill last Tuesday. After nearly causing a shutdown of the DHS two weeks ago and passing a temporary bill that allowed the DHS to remain funded for one week, the Republican leadership caved in on Tuesday and passed a “clean” bill that was identical to the bill the Senate passed at the 11th hour on February 27th. Speaker Boehner talked a big game leading up to last week that the Republicans were not going to fund the DHS until they had effectively stopped President Obama’s executive action on immigration. But in the end the Speaker has so little control over even his own party that he was forced to bring the bill up for a vote, which it easily passed 257 for and 167 against. There were a total of 75 Republicans that crossed the aisle and voted in favor of the bill. Why does this matter to the financial markets? It matters to the financial markets because it goes to show that Congress is not working well at this point and that getting much of anything done over the course of the next 18 months will be like pulling teeth. So while most of what Congress does is on autopilot, should something come up that needs congressional approval to move forward, it will likely be hung up in the House and may cause issues by being delayed. It really just adds to uncertainty and uncertainty is something the financial markets are always uncomfortable with. The other big news of the week in the US last week was on the labor front and came in the form of the latest unemployment rate as well as the payroll numbers, wage growth and participation rate.
The financial markets in the US turned noticeably lower on Friday last week as investors adjusted everything from fixed income to equity positions as they get ready for interest rates to start to move higher in either June or September. The reason for the excitement on Friday was that the government released its latest figures, which showed that the unemployment rate fell in the US down to 5.5 percent during February, while the payroll figures were very strong for the month as well. What was a little less publicized was the fact that the labor force participation rate fell during the month, as depicted in the chart to the right, created on the Bureau of Labor Statistics’ webpage. 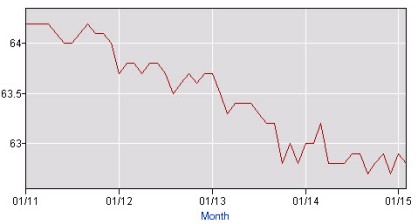 Another measure of underemployment is the so called U6 rate, which measures both the unemployed and the underemployed (i.e. someone working fast food with a masters degree); this rate is still at 11 percent and is one of the rates Fed Chair Yellen likes to use in her analysis. Another variable she looks at is wage growth, which has been nearly dead flat since October of 2009, running at about 2 percent, well under the more typical pace of 3 percent. Until we get the labor force participation rate and wages moving higher, it is hard to believe the labor market is as positive as some pundits on TV are trying to spin it. Nonetheless, the markets took the labor news in aggregate and said it looks good enough that rates may start to move pretty soon. I am still a little skeptical as the surface numbers seem to look okay, but the underlying figures seem like they still have a ways to go and that they are not currently moving in the correct direction. While all of this was going on, earnings season was still rolling for corporate American, but it is quickly winding down.
Last week was the first week of the big slow down in earnings announcements. From here through the end of March we will get a few straggler earnings announcements each week. Below is a table of the better known companies that released earnings last week with earnings that missed expectations highlighted in red, while earnings that beat expectations by more than 10 percent are highlighted in green:
| Abercrombie & Fitch |
2% |
Foot Locker |
11% |
PetSmart |
4% |
| Autozone |
2% |
Greif |
-19% |
Progressive |
pushed |
| Best Buy |
9% |
H & R Block |
54% |
Revlon |
pushed |
| Big Lots |
1% |
Joy Global |
-34% |
Smith & Wesson |
82% |
| Costco Wholesale |
15% |
Kate Spade |
-11% |
Sotheby’s |
-10% |
| Dick’s Sporting Goods |
7% |
Kroger |
16% |
Staples |
3% |
There were no major surprises last week in corporate earnings, but there were a few releases that caught the attention of the markets. Smith and Wesson beat market expectations by 82 percent, despite seeing continued declines in their long guns division as these declines were more than offset by the increased number of handgun sales around the country. Two higher end companies that fell on hard times and reported earnings last week included Kate Spade and Sotheby’s as sales were slightly below expectations at both retailers. Costco saw a positive earnings announcement last week as it looks like the small businesses that shop there in the US were increasing their demand throughout the quarter.
According to Factset Research, we have now seen 496 (99.2 percent) of the S&P 500 companies release their results for the fourth quarter of 2014. Of the 496 that have released, 75 percent of them have met or beaten earnings estimates (this is down 1 percent from two weeks ago), while 25 percent have fallen short of expectations. When looking at revenue of the companies that have reported, 58 percent of the companies have beaten estimates (this number is down 1 percent from two weeks ago), while 42 percent have fallen short. The major driving sectors behind the strong earnings announcements have been telecommunications and healthcare, while the laggard not surprisingly continues to be energy. The overall blended earnings growth rate for the fourth quarter of 2014 looks like it will come in at about 3.7 percent. Forward looking guidance changed by only one company last week as there have now been 82 companies that have issued negative guidance, while the number of positive guidance releases by companies has remained unchanged at 15. With only four companies left to report earnings out of the S&P 500 it has become virtually impossible for the numbers, as far as the number of companies beating on earnings or revenues, to change from their current levels. The numbers above are likely what they will be for the quarter, which means the fourth quarter of 2014 will go down as a better than average quarter, but one that saw some darkening clouds on the horizon.
This week sees a massive drop off in the quantity of companies releasing their fourth quarter earnings numbers compared to the past few weeks. Although there are still a few companies that are well known it will become even slimmer in the coming weeks. Below is a table of the better known companies that will releases their earnings this week, with the releases that have the most potential to impact the markets highlighted in green:
| Barnes & Noble |
Krispy Kreme Doughnuts |
Ulta Salon |
| Buckle |
Men’s Wearhouse |
Urban Outfitters |
| Dollar General |
Revlon |
Vail Resorts |
| El Pollo Loco |
Rosetta Stone |
Williams-Sonoma |
| Express |
Shake Shack |
Zoe’s Kitchen |
| Kirkland’s |
Stein Mart |
Zumiez |
Specialty retailers seem to be the name of the game this week for earnings announcements as there are a very high percentage of them releasing earnings. Shake Shack will be closely watched this week as it is the first quarter earnings results release for the company since they went public back on February 2nd of this year. Dollar General will also be very closely watched as it is one of the last “deep discount” retailers to report earnings, a group that so far has not seen the boost that was expected due to the decline in the price of gasoline around the US.
International News: International news last week was largely quiet as the world awaits the start of bond buying by the European Central Bank (ECB), which officially starts today! The plan has been years in the making and now we will start to see if this is going to work or if the Europeans will have to go back to the drawing board for a new plan to fix their dwindling economies. Elsewhere in Europe, Ukraine also made a few headlines last week as the cease-fire now looks like it is actually in place with both sides pulling back some of their heavy weaponry and swapping prisoners. Things will likely remain calm over there until Russian President Putin decides that now is another good time to take more land from Europe and decides to push further into the former Soviet states in a modern land grab that no one seems to be willing to stop. The other major news on the international front last week came out of China as the National People’s Congress held its annual session in Beijing last Thursday.
The National People’s Congress is similar to the US Congress with many “elected” officials and political party big wigs present to hear from their leaders. The only difference is that there is no debate on anything since China is a command and control driven country. The Premier Li Keqiang gave one of the more important speeches of the day with the “Work Report,” essentially a report about the current state of the economy in China. In the report the growth expectations for 2015 have been lowered to 7 percent from the previously released 7.5 percent. The budget deficit is projected to be 2.3 percent of GDP and, on the jobs front, China wants to create 10 million new jobs during 2015. To give everyone a little perspective on just how many jobs that 10 million goal entails, the US only managed to create a little under 3 million jobs during 2015 with all of the programs in place and help from the government for employees to find work and for employers to hire them. In general, in the US 200,000 jobs being created per month is considered strong growth, so a strong growth year would be anything above 2.4 million or roughly one quarter of China’s goal. While it is a “goal,” the number will be achieved during 2015 because China is notorious for setting a number and achieving that number at all costs, even if it is just completely fabricated. Other highlights from the speech included a pledge not to allow the unemployment rate to go above 4.5 percent during 2015, to cut carbon emissions by 3.1 percent and to achieve trade growth of 6 percent during 2015. In an interesting part of the speech, the Premier mentioned that the government will encourage mergers and the closing of over supplied sectors of the economy. This was seen as a suggestion that some of the very large state run enterprises would likely be buying up smaller companies to extend state control during the year, while at the same time stamping out corruption, which has been the name of the game so far under the new leadership.
Market Statistics:
| Index |
Change |
Volume |
| NASDAQ |
-0.73% |
Average |
| Dow |
-1.52% |
Average |
| S&P 500 |
-1.58% |
Average |
The NASDAQ could not make it five weeks in a row of gains, finally succumbing last week and posting a weekly decline. Both the S&P 500 and the Dow veered off track two weeks ago when they posted their first weekly declines in several weeks. Last week’s trading was driven almost entirely by speculation as to when the Fed will start to raise interest rates, and the amusing part of the debate is that it doesn’t really matter when they start to increase interest rates in the grand scheme of things, as mentioned above. Volume was low for the week going into Friday, but the market reaction to the jobs report on Friday was enough to pull all three of the major US averages back up to average volume for the week.
When looking at sectors, the following were the top 5 and bottom 5 performers over the course of the previous week:
| Top 5 Sectors |
Change |
|
Bottom 5 Sectors |
Change |
| Biotechnology |
1.45% |
|
Utilities |
-4.10% |
| Regional Banks |
1.27% |
|
Energy |
-3.66% |
| Broker Dealers |
0.97% |
|
Materials |
-3.52% |
| Pharmaceuticals |
0.55% |
|
Residential Real Estate |
-3.51% |
| Semiconductors |
0.37% |
|
Infrastructure |
-3.33% |
With the NASDAQ once again being the best of the three major indexes it was not surprising to see that three of the top five sectors of the market last week were technology based. Biotechnology got a nice boost from a few announcements from the FDA as well as merger speculation as the sector continues to be going through a massive round of M&A as big companies have lots of cash and cheap financing to go and acquire other companies. Utilities continued to see the weakest performance last week as the sector declined as the yield on the 10-year US bond increased. This occurs because as rates move higher on government bonds, and the 10-year in particular, some investors will hop out of the safest of equity sectors like utilities, which pays a nice dividend, in favor of the even more safe US government bonds. This rotation out of equities and back into fixed income as rates increase is one of the aspects of the Fed increasing rates causing some concern for many investors.
Fixed income fell off the proverbial cliff last week as investors adjusted their portfolios to the prospects of a rate hike before September:
| Fixed Income |
Change |
| Long (20+ years) |
-4.66% |
| Middle (7-10 years) |
-2.00% |
| Short (less than 1 year) |
-0.01% |
| TIPS |
-1.90% |
The drop in the long end of the yield curve was almost entirely done on Friday after the jobs report and really shows investors’ willingness to sell the long end of the curve in favor of buying the short end of the curve. This type of trade sets up investors to take advantage of raising interest rates in the future. Last week the US dollar increased in value by 2.38 percent against a basket of international currencies, making it three weeks in a row of gains. The strongest of the major global currencies last week was the Canadian Dollar as it lost 0.85 percent against the US dollar. The weakest of the major global currencies last week was the Swiss franc as it fell by 3.27 percent against the value of the US dollar. This flight to the US dollar is also a function of the prospects of the US Fed raising interest rates sooner and other central banks continuing to embark on quantitative easing actions.
Commodities and metals were mixed last week as oil had a pretty tame week, while metals really took it on the chin:
| Metals |
Change |
|
Commodities |
Change |
| Gold |
-3.70% |
|
Oil |
0.53% |
| Silver |
-4.28% |
|
Livestock |
0.56% |
| Copper |
-3.20% |
|
Grains |
-3.62% |
|
|
|
Agriculture |
-2.08% |
The overall Goldman Sachs Commodity Index turned in a loss of 2.06 percent last week. Oil experienced one of the more tame weeks that we have seen all year as prices finally look like they have stabilized for the near term. Metals really took a hard hit last week with Gold declining almost 4 percent, while Silver slid 4.28 percent and Copper dropped 3.2 percent. The decline in Gold appears to have occurred as investors saw the metal fail to stay above the $1,200 per ounce level. Silver is really just a cheaper proxy for Gold, so it was not surprising to see that it traded in the same direction and roughly the same magnitude as Gold. Copper, on the other hand, suffered last week as the slowdown in the Chinese economy seemed to be confirmed by the National People’s Congress meeting, during which the future growth rates for China’s economy were laid out. The soft commodities traded very differently last week as agriculture and grains fell and livestock increased in value.
On the international front last week, South Korea saw the best performance of the week with Se KOSPI Index gaining 1.37. Brazil brought up the rear last week in terms of global index performances as it declined by 3.11 percent after fears continued to circulate that Dilma Rousseff may not be able to hold as much control over business as she has in the past, in addition to reports of poor preparations for the upcoming Olympic Games to be held in Brazil during 2016. Last week was one of the first weeks in a long time that we did not see Russia in either the top or bottom spot in terms of weekly performance as the situation in Ukraine seems like it may be moving toward a diplomatic solution and not a war.
Last week the VIX could not make it three weeks in a row of moving less than 10 percent during the week as it jumped by 13.94 percent. Not all of the upward move was done on Friday when the markets were moving lower. In fact, the VIX moved a very small amount on Friday relative to the size of the move in the overall markets. After touching the lowest level of the year on the last day of trading in February the VIX steadily increased last week, capping off the week with a gain of more than 8 percent on Friday. At the current level of 15.20 the VIX is implying a move of 4.39 percent over the course of the next 30 days. As always, the direction of the move is unknown.
For the trading week ending on 3/6/2015, returns in FSI’s hypothetical models* (net of a 1% annual management fee) were as follows:
|
Last Week |
Year to Date |
| Aggressive Model |
-2.51 % |
0.31 % |
| Aggressive Benchmark |
-1.58 % |
1.68 % |
| Growth Model |
-2.22 % |
-0.11 % |
| Growth Benchmark |
-1.23 % |
1.34 % |
| Moderate Model |
-1.84 % |
-0.41 % |
| Moderate Benchmark |
-0.88 % |
0.97 % |
| Income Model |
-1.54 % |
-0.41 % |
| Income Benchmark |
-0.43 % |
0.52 % |
*Model performance does not represent any specific account performance but rather a model of holdings based on risk levels that are like our actual holdings, the hypothetical models are rebalanced daily to model targets.
We made no changes to our models over the course of the previous week. We are actively assessing our holdings, looking for areas that need to be trimmed and, more importantly, looking for what to do with any cash we currently hold or may be holding in the near future. The same areas of the market that have been looking good for a few weeks, areas that we already have an established position in, look like they will be the best spots to move into and includes sectors such as healthcare, semiconductors and pharmaceuticals. Our biggest area of concern right now is Utilities and the adverse reaction we saw out of the sector as a whole on pure speculation as to when interest rates will start moving higher. It seems a little strange that investors would jump out of utility equity positions in favor of US government bonds, but that appears to have been the case last week. With yields on the 10-year bond moving north of 2.25 percent, the yield increase by being in utilities (currently yielding about 3.3) is starting to be eroded, while the volatility of the equities is seen as much higher than the alternative fixed income.
Economic News: Last week was a typical week for economic news releases as we started March of 2015. There were two releases that significantly beat expectations highlighted below in green and one release that significantly missed market expectations, highlighted in red below:
| Economic Impact |
Date |
Economic News Release |
Date Range |
Actual |
Expectation |
| Neutral |
3/2/2015 |
Personal Income |
January 2015 |
0.30% |
0.40% |
| Slightly Negative |
3/2/2015 |
Personal Spending |
January 2015 |
-0.20% |
-0.10% |
| Neutral |
3/2/2015 |
ISM Index |
February 2015 |
52.8 |
53 |
| Neutral |
3/4/2015 |
ADP Employment Change |
February 2015 |
212K |
220K |
| Neutral |
3/4/2015 |
ISM Services |
February 2015 |
56.9 |
56.5 |
| Slightly Negative |
3/5/2015 |
Initial Claims |
Previous Week |
320K |
295K |
| Neutral |
3/5/2015 |
Continuing Claims |
Previous Week |
2421K |
2404K |
| Negative |
3/5/2015 |
Factory Orders |
January 2015 |
-0.20% |
0.60% |
| Positive |
3/6/2015 |
Nonfarm Payrolls |
February 2015 |
295K |
240K |
| Positive |
3/6/2015 |
Nonfarm Private Payrolls |
February 2015 |
288K |
230K |
| Slightly Positive |
3/6/2015 |
Unemployment Rate |
February 2015 |
5.50% |
5.60% |
| Neutral |
3/6/2015 |
Consumer Credit |
January 2015 |
$11.6B |
$14.0B |
Data for table from Econoday.com, Bloomberg and Yahoo Finance
Last week started off on Monday with the release of personal income and spending for the month of January, which saw income increase slightly and spending continue to decrease. The decline in personal spending can be attributed to the decline in gasoline prices at the pump; the money that was saved at the pump just was not put back into buying other items during the month. This flies directly in the face of many economists who thought that falling oil and gas prices would for sure lead to an increase in consumer spending; so far we have yet to see this phenomenon. Also released on Monday was the overall ISM Index for the month of February, which came in almost exactly as expected by the markets and was a non-market moving event. On Wednesday the first of the employment related releases was released, that being the ADP employment change figure for the month of February, which showed that 212,000 jobs had been created during the month, a number that is not great but not bad either. Also released on Wednesday was the services side of the ISM, which also came in very close to market expectations and was hardly even noticed by the markets. On Thursday the standard weekly employment related figures were released with initial jobless claims missing expectations and jumping over the psychological 300,000 level. While this is concerning we will have to get more than just a single data point for the market to become concerned about the jobs market in any meaningful way. Also released on Thursday was a poor reading on factory orders with orders declining two tenths of a percent, while expectations had been for an increase of six tenths of a percent. The market seemed to overlook this release, however, and focus more on speculating about the employment reports due out the next day. On Friday the government released its latest overall unemployment rate for the month of February and it came in at 5.5 percent, down one tenth of a percent from the 5.6 percent seen during January. Both nonfarm public and private payroll figures came in nicely above market expectations with both figures pushing up near 300,000 during the month. This is the type of job growth we need for the US economy to really start moving forward at a meaningful rate of speed. These releases, however, were also what caused the markets to move significantly lower on Friday as investors are now thinking that an interest rate hike coming from the Fed may be sooner rather than later. While the odds of a Fed rate hike still favor September, the potential of a June hike seems to be increasing with some of these latest economic reports.
This week is a very slow week for economic news releases with all of the releases occurring on the last two trading days of the week. The releases highlighted below have the potential to move the overall markets on the day they are released:
| Date |
Release |
Release Range |
Market Expectation |
| 3/12/2015 |
Initial Claims |
Previous Week |
306K |
| 3/12/2015 |
Continuing Claims |
Previous Week |
2421K |
| 3/12/2015 |
Retail Sales |
February 2015 |
0.40% |
| 3/12/2015 |
Retail Sales ex-auto |
February 2015 |
0.60% |
| 3/13/2015 |
PPI |
February 2015 |
0.30% |
| 3/13/2015 |
Core PPI |
February 2015 |
0.10% |
| 3/13/2015 |
University of Michigan Consumer Sentiment Index |
March 2015 |
95.8 |
Data for table from Econoday.com, Bloomberg and Yahoo Finance
This week starts on Thursday with the release of the standard weekly employment reports; after the spike we saw in the initial jobless claims number last week the markets will be watching closely this week to see if a trend of prints over 300,000 starts or if last week’s numbers were just a fluke. Perhaps more important on Thursday than the jobs figures is the release of retail sales for the month of February, which are expected to be positive, but just by a little, with overall sales expected to post a gain of 0.4 percent, while sales excluding automobiles are expected to post a gain of 0.6 percent. If the number on either of these two releases misses significantly and prints a decline during the month the market will likely react, but the reaction remains unknown as a negative print may make investors think the Fed will hold off on increasing interest rates and thus cause the markets to move higher. On Friday the Producer Price Index (PPI) for the month of February as well as the core PPI for the same time period are set to be released with expectations that prices at the producer level will be shown to have increased very slightly during the month as the prices of raw materials and energy have stabilized and in some cases moved up slightly during the month. Wrapping up the week on Friday is the release of the University of Michigan’s Consumer Sentiment Index for the month of March, which is expected to show almost no change from the end of February level of 95.4, increasing slightly to 95.8. With all of the other consumer data seemingly pointing to a slowdown in confidence the market may look at this release a little more than normal, but it would take something very out of the ordinary for the markets to really react. In addition to the scheduled news releases there are also three different Federal Reserve officials speaking this week, all on Monday and all at almost the same time, but at different venues. It is highly unlikely they will mention anything that is new, but the market will likely hang on their every word for any insight into when the Fed may start to increase interest rates nonetheless.
Fun fact of the week—China
By 2030, China will have 200 million college graduates—more than the entire U.S. workforce.
Have a great week!

Peter’s Financial Market Commentary March 9th 2015
March 9, 2015
For a PDF version of the below commentary please click here Weekly Letter 3-9-2015
Commentary at a glance:
-US markets turned sharply lower on Friday amid speculation about the first fed rate hike.
-What’s that? Egg on Boehner face again!
-National People’s Congress held its annual meeting in Beijing.
-Earnings season in the US has drawn to a virtual close for the fourth quarter of 2014.
-Economic data showed a strong performance on the surface labor market, which tipped off rate hike fears.
Market Wrap-Up: After having the Dow break down below its support level two weeks ago last week it was the S&P 500’s turn do to so and it did so in a noticeable way. While the equity markets were moving the VIX was also moving, but to a much more muted degree than one might expect given the decline we saw on Friday. The charts below are of the three major US indexes in green with their respective trading channels being drawn by the red lines. The VIX (lower right pane below) is drawn with the index in green and the one year average level of the VIX drawn with the red line:
In terms of which of the indexes is currently the strongest, there was no change over the previous week; the NASDAQ is clearly ahead of both the S&P 500 and the Dow. Even with the decline seen last week on NASDAQ, it is still not even close to breaking down into or below its most recent trading channel. In fact, the NASDAQ is closer to making a new all time high than it is to moving back into its trading channel. Both the S&P 500 and the Dow remain well below their respective trading channels and it looks like they are likely not going to make it back to them any time soon. One item that could help the Dow in particular is that AT&T is being dropped as one of the 30 component companies in the Dow and being replaced with Apple. Initially, Apple will have a 4.66 percent weighting in the index, but over the longer term the outlook for Apple is much brighter than it is for AT&T, so it could be a very positive development for the index. After such a decline on the S&P 500 and the Dow, like the one seen on Friday, it would not be unusual for the markets to bounce higher in the following few trading days. This is because the markets tend to overreact both on the positive and on the negative news that moves the markets. Adding to this theory is the fact that the decline last week was done on just average volume and if this was truly the start of a blowout decline, you would normally see volume spiking higher along with the VIX; both of which did not occur last week. In large previous moves to the downside the VIX typically moves noticeably higher and while it did move higher on Friday it did so by less than 10 percent, which means that options traders were not reacting to the market movements, but instead sort of calling its bluff. Looking at trading so far on Monday, it looks like they were correct. Movement of the markets from here is anyone’s guess as speculation on every economic report and speech given by Federal Reserve officials will likely be dissected thousands of times in futile attempts to gain some unknown insight into when the Fed will start to raise interest rates.
National News: John Boehner has once again come out looking like the court jester in Congress as he passed a clean Department of Homeland Security (DHS) funding bill last Tuesday. After nearly causing a shutdown of the DHS two weeks ago and passing a temporary bill that allowed the DHS to remain funded for one week, the Republican leadership caved in on Tuesday and passed a “clean” bill that was identical to the bill the Senate passed at the 11th hour on February 27th. Speaker Boehner talked a big game leading up to last week that the Republicans were not going to fund the DHS until they had effectively stopped President Obama’s executive action on immigration. But in the end the Speaker has so little control over even his own party that he was forced to bring the bill up for a vote, which it easily passed 257 for and 167 against. There were a total of 75 Republicans that crossed the aisle and voted in favor of the bill. Why does this matter to the financial markets? It matters to the financial markets because it goes to show that Congress is not working well at this point and that getting much of anything done over the course of the next 18 months will be like pulling teeth. So while most of what Congress does is on autopilot, should something come up that needs congressional approval to move forward, it will likely be hung up in the House and may cause issues by being delayed. It really just adds to uncertainty and uncertainty is something the financial markets are always uncomfortable with. The other big news of the week in the US last week was on the labor front and came in the form of the latest unemployment rate as well as the payroll numbers, wage growth and participation rate.
The financial markets in the US turned noticeably lower on Friday last week as investors adjusted everything from fixed income to equity positions as they get ready for interest rates to start to move higher in either June or September. The reason for the excitement on Friday was that the government released its latest figures, which showed that the unemployment rate fell in the US down to 5.5 percent during February, while the payroll figures were very strong for the month as well. What was a little less publicized was the fact that the labor force participation rate fell during the month, as depicted in the chart to the right, created on the Bureau of Labor Statistics’ webpage. Another measure of underemployment is the so called U6 rate, which measures both the unemployed and the underemployed (i.e. someone working fast food with a masters degree); this rate is still at 11 percent and is one of the rates Fed Chair Yellen likes to use in her analysis. Another variable she looks at is wage growth, which has been nearly dead flat since October of 2009, running at about 2 percent, well under the more typical pace of 3 percent. Until we get the labor force participation rate and wages moving higher, it is hard to believe the labor market is as positive as some pundits on TV are trying to spin it. Nonetheless, the markets took the labor news in aggregate and said it looks good enough that rates may start to move pretty soon. I am still a little skeptical as the surface numbers seem to look okay, but the underlying figures seem like they still have a ways to go and that they are not currently moving in the correct direction. While all of this was going on, earnings season was still rolling for corporate American, but it is quickly winding down.
Last week was the first week of the big slow down in earnings announcements. From here through the end of March we will get a few straggler earnings announcements each week. Below is a table of the better known companies that released earnings last week with earnings that missed expectations highlighted in red, while earnings that beat expectations by more than 10 percent are highlighted in green:
There were no major surprises last week in corporate earnings, but there were a few releases that caught the attention of the markets. Smith and Wesson beat market expectations by 82 percent, despite seeing continued declines in their long guns division as these declines were more than offset by the increased number of handgun sales around the country. Two higher end companies that fell on hard times and reported earnings last week included Kate Spade and Sotheby’s as sales were slightly below expectations at both retailers. Costco saw a positive earnings announcement last week as it looks like the small businesses that shop there in the US were increasing their demand throughout the quarter.
According to Factset Research, we have now seen 496 (99.2 percent) of the S&P 500 companies release their results for the fourth quarter of 2014. Of the 496 that have released, 75 percent of them have met or beaten earnings estimates (this is down 1 percent from two weeks ago), while 25 percent have fallen short of expectations. When looking at revenue of the companies that have reported, 58 percent of the companies have beaten estimates (this number is down 1 percent from two weeks ago), while 42 percent have fallen short. The major driving sectors behind the strong earnings announcements have been telecommunications and healthcare, while the laggard not surprisingly continues to be energy. The overall blended earnings growth rate for the fourth quarter of 2014 looks like it will come in at about 3.7 percent. Forward looking guidance changed by only one company last week as there have now been 82 companies that have issued negative guidance, while the number of positive guidance releases by companies has remained unchanged at 15. With only four companies left to report earnings out of the S&P 500 it has become virtually impossible for the numbers, as far as the number of companies beating on earnings or revenues, to change from their current levels. The numbers above are likely what they will be for the quarter, which means the fourth quarter of 2014 will go down as a better than average quarter, but one that saw some darkening clouds on the horizon.
This week sees a massive drop off in the quantity of companies releasing their fourth quarter earnings numbers compared to the past few weeks. Although there are still a few companies that are well known it will become even slimmer in the coming weeks. Below is a table of the better known companies that will releases their earnings this week, with the releases that have the most potential to impact the markets highlighted in green:
Specialty retailers seem to be the name of the game this week for earnings announcements as there are a very high percentage of them releasing earnings. Shake Shack will be closely watched this week as it is the first quarter earnings results release for the company since they went public back on February 2nd of this year. Dollar General will also be very closely watched as it is one of the last “deep discount” retailers to report earnings, a group that so far has not seen the boost that was expected due to the decline in the price of gasoline around the US.
International News: International news last week was largely quiet as the world awaits the start of bond buying by the European Central Bank (ECB), which officially starts today! The plan has been years in the making and now we will start to see if this is going to work or if the Europeans will have to go back to the drawing board for a new plan to fix their dwindling economies. Elsewhere in Europe, Ukraine also made a few headlines last week as the cease-fire now looks like it is actually in place with both sides pulling back some of their heavy weaponry and swapping prisoners. Things will likely remain calm over there until Russian President Putin decides that now is another good time to take more land from Europe and decides to push further into the former Soviet states in a modern land grab that no one seems to be willing to stop. The other major news on the international front last week came out of China as the National People’s Congress held its annual session in Beijing last Thursday.
The National People’s Congress is similar to the US Congress with many “elected” officials and political party big wigs present to hear from their leaders. The only difference is that there is no debate on anything since China is a command and control driven country. The Premier Li Keqiang gave one of the more important speeches of the day with the “Work Report,” essentially a report about the current state of the economy in China. In the report the growth expectations for 2015 have been lowered to 7 percent from the previously released 7.5 percent. The budget deficit is projected to be 2.3 percent of GDP and, on the jobs front, China wants to create 10 million new jobs during 2015. To give everyone a little perspective on just how many jobs that 10 million goal entails, the US only managed to create a little under 3 million jobs during 2015 with all of the programs in place and help from the government for employees to find work and for employers to hire them. In general, in the US 200,000 jobs being created per month is considered strong growth, so a strong growth year would be anything above 2.4 million or roughly one quarter of China’s goal. While it is a “goal,” the number will be achieved during 2015 because China is notorious for setting a number and achieving that number at all costs, even if it is just completely fabricated. Other highlights from the speech included a pledge not to allow the unemployment rate to go above 4.5 percent during 2015, to cut carbon emissions by 3.1 percent and to achieve trade growth of 6 percent during 2015. In an interesting part of the speech, the Premier mentioned that the government will encourage mergers and the closing of over supplied sectors of the economy. This was seen as a suggestion that some of the very large state run enterprises would likely be buying up smaller companies to extend state control during the year, while at the same time stamping out corruption, which has been the name of the game so far under the new leadership.
Market Statistics:
The NASDAQ could not make it five weeks in a row of gains, finally succumbing last week and posting a weekly decline. Both the S&P 500 and the Dow veered off track two weeks ago when they posted their first weekly declines in several weeks. Last week’s trading was driven almost entirely by speculation as to when the Fed will start to raise interest rates, and the amusing part of the debate is that it doesn’t really matter when they start to increase interest rates in the grand scheme of things, as mentioned above. Volume was low for the week going into Friday, but the market reaction to the jobs report on Friday was enough to pull all three of the major US averages back up to average volume for the week.
When looking at sectors, the following were the top 5 and bottom 5 performers over the course of the previous week:
With the NASDAQ once again being the best of the three major indexes it was not surprising to see that three of the top five sectors of the market last week were technology based. Biotechnology got a nice boost from a few announcements from the FDA as well as merger speculation as the sector continues to be going through a massive round of M&A as big companies have lots of cash and cheap financing to go and acquire other companies. Utilities continued to see the weakest performance last week as the sector declined as the yield on the 10-year US bond increased. This occurs because as rates move higher on government bonds, and the 10-year in particular, some investors will hop out of the safest of equity sectors like utilities, which pays a nice dividend, in favor of the even more safe US government bonds. This rotation out of equities and back into fixed income as rates increase is one of the aspects of the Fed increasing rates causing some concern for many investors.
Fixed income fell off the proverbial cliff last week as investors adjusted their portfolios to the prospects of a rate hike before September:
The drop in the long end of the yield curve was almost entirely done on Friday after the jobs report and really shows investors’ willingness to sell the long end of the curve in favor of buying the short end of the curve. This type of trade sets up investors to take advantage of raising interest rates in the future. Last week the US dollar increased in value by 2.38 percent against a basket of international currencies, making it three weeks in a row of gains. The strongest of the major global currencies last week was the Canadian Dollar as it lost 0.85 percent against the US dollar. The weakest of the major global currencies last week was the Swiss franc as it fell by 3.27 percent against the value of the US dollar. This flight to the US dollar is also a function of the prospects of the US Fed raising interest rates sooner and other central banks continuing to embark on quantitative easing actions.
Commodities and metals were mixed last week as oil had a pretty tame week, while metals really took it on the chin:
The overall Goldman Sachs Commodity Index turned in a loss of 2.06 percent last week. Oil experienced one of the more tame weeks that we have seen all year as prices finally look like they have stabilized for the near term. Metals really took a hard hit last week with Gold declining almost 4 percent, while Silver slid 4.28 percent and Copper dropped 3.2 percent. The decline in Gold appears to have occurred as investors saw the metal fail to stay above the $1,200 per ounce level. Silver is really just a cheaper proxy for Gold, so it was not surprising to see that it traded in the same direction and roughly the same magnitude as Gold. Copper, on the other hand, suffered last week as the slowdown in the Chinese economy seemed to be confirmed by the National People’s Congress meeting, during which the future growth rates for China’s economy were laid out. The soft commodities traded very differently last week as agriculture and grains fell and livestock increased in value.
On the international front last week, South Korea saw the best performance of the week with Se KOSPI Index gaining 1.37. Brazil brought up the rear last week in terms of global index performances as it declined by 3.11 percent after fears continued to circulate that Dilma Rousseff may not be able to hold as much control over business as she has in the past, in addition to reports of poor preparations for the upcoming Olympic Games to be held in Brazil during 2016. Last week was one of the first weeks in a long time that we did not see Russia in either the top or bottom spot in terms of weekly performance as the situation in Ukraine seems like it may be moving toward a diplomatic solution and not a war.
Last week the VIX could not make it three weeks in a row of moving less than 10 percent during the week as it jumped by 13.94 percent. Not all of the upward move was done on Friday when the markets were moving lower. In fact, the VIX moved a very small amount on Friday relative to the size of the move in the overall markets. After touching the lowest level of the year on the last day of trading in February the VIX steadily increased last week, capping off the week with a gain of more than 8 percent on Friday. At the current level of 15.20 the VIX is implying a move of 4.39 percent over the course of the next 30 days. As always, the direction of the move is unknown.
For the trading week ending on 3/6/2015, returns in FSI’s hypothetical models* (net of a 1% annual management fee) were as follows:
*Model performance does not represent any specific account performance but rather a model of holdings based on risk levels that are like our actual holdings, the hypothetical models are rebalanced daily to model targets.
We made no changes to our models over the course of the previous week. We are actively assessing our holdings, looking for areas that need to be trimmed and, more importantly, looking for what to do with any cash we currently hold or may be holding in the near future. The same areas of the market that have been looking good for a few weeks, areas that we already have an established position in, look like they will be the best spots to move into and includes sectors such as healthcare, semiconductors and pharmaceuticals. Our biggest area of concern right now is Utilities and the adverse reaction we saw out of the sector as a whole on pure speculation as to when interest rates will start moving higher. It seems a little strange that investors would jump out of utility equity positions in favor of US government bonds, but that appears to have been the case last week. With yields on the 10-year bond moving north of 2.25 percent, the yield increase by being in utilities (currently yielding about 3.3) is starting to be eroded, while the volatility of the equities is seen as much higher than the alternative fixed income.
Economic News: Last week was a typical week for economic news releases as we started March of 2015. There were two releases that significantly beat expectations highlighted below in green and one release that significantly missed market expectations, highlighted in red below:
Data for table from Econoday.com, Bloomberg and Yahoo Finance
Last week started off on Monday with the release of personal income and spending for the month of January, which saw income increase slightly and spending continue to decrease. The decline in personal spending can be attributed to the decline in gasoline prices at the pump; the money that was saved at the pump just was not put back into buying other items during the month. This flies directly in the face of many economists who thought that falling oil and gas prices would for sure lead to an increase in consumer spending; so far we have yet to see this phenomenon. Also released on Monday was the overall ISM Index for the month of February, which came in almost exactly as expected by the markets and was a non-market moving event. On Wednesday the first of the employment related releases was released, that being the ADP employment change figure for the month of February, which showed that 212,000 jobs had been created during the month, a number that is not great but not bad either. Also released on Wednesday was the services side of the ISM, which also came in very close to market expectations and was hardly even noticed by the markets. On Thursday the standard weekly employment related figures were released with initial jobless claims missing expectations and jumping over the psychological 300,000 level. While this is concerning we will have to get more than just a single data point for the market to become concerned about the jobs market in any meaningful way. Also released on Thursday was a poor reading on factory orders with orders declining two tenths of a percent, while expectations had been for an increase of six tenths of a percent. The market seemed to overlook this release, however, and focus more on speculating about the employment reports due out the next day. On Friday the government released its latest overall unemployment rate for the month of February and it came in at 5.5 percent, down one tenth of a percent from the 5.6 percent seen during January. Both nonfarm public and private payroll figures came in nicely above market expectations with both figures pushing up near 300,000 during the month. This is the type of job growth we need for the US economy to really start moving forward at a meaningful rate of speed. These releases, however, were also what caused the markets to move significantly lower on Friday as investors are now thinking that an interest rate hike coming from the Fed may be sooner rather than later. While the odds of a Fed rate hike still favor September, the potential of a June hike seems to be increasing with some of these latest economic reports.
This week is a very slow week for economic news releases with all of the releases occurring on the last two trading days of the week. The releases highlighted below have the potential to move the overall markets on the day they are released:
Data for table from Econoday.com, Bloomberg and Yahoo Finance
This week starts on Thursday with the release of the standard weekly employment reports; after the spike we saw in the initial jobless claims number last week the markets will be watching closely this week to see if a trend of prints over 300,000 starts or if last week’s numbers were just a fluke. Perhaps more important on Thursday than the jobs figures is the release of retail sales for the month of February, which are expected to be positive, but just by a little, with overall sales expected to post a gain of 0.4 percent, while sales excluding automobiles are expected to post a gain of 0.6 percent. If the number on either of these two releases misses significantly and prints a decline during the month the market will likely react, but the reaction remains unknown as a negative print may make investors think the Fed will hold off on increasing interest rates and thus cause the markets to move higher. On Friday the Producer Price Index (PPI) for the month of February as well as the core PPI for the same time period are set to be released with expectations that prices at the producer level will be shown to have increased very slightly during the month as the prices of raw materials and energy have stabilized and in some cases moved up slightly during the month. Wrapping up the week on Friday is the release of the University of Michigan’s Consumer Sentiment Index for the month of March, which is expected to show almost no change from the end of February level of 95.4, increasing slightly to 95.8. With all of the other consumer data seemingly pointing to a slowdown in confidence the market may look at this release a little more than normal, but it would take something very out of the ordinary for the markets to really react. In addition to the scheduled news releases there are also three different Federal Reserve officials speaking this week, all on Monday and all at almost the same time, but at different venues. It is highly unlikely they will mention anything that is new, but the market will likely hang on their every word for any insight into when the Fed may start to increase interest rates nonetheless.
Fun fact of the week—China
By 2030, China will have 200 million college graduates—more than the entire U.S. workforce.
Have a great week!
Tagged: China 7% growth, Investment advice, market commentary, market correction, stock market commentary, weekly market commentary